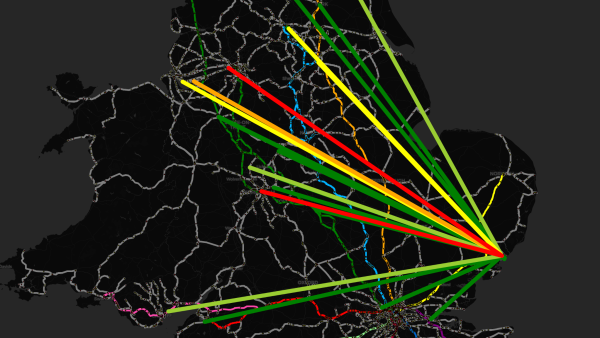
Shows straight lines to the origin and destination for any schedules that uses this tiploc.
Origin - Tiploc - Destination
Detailed
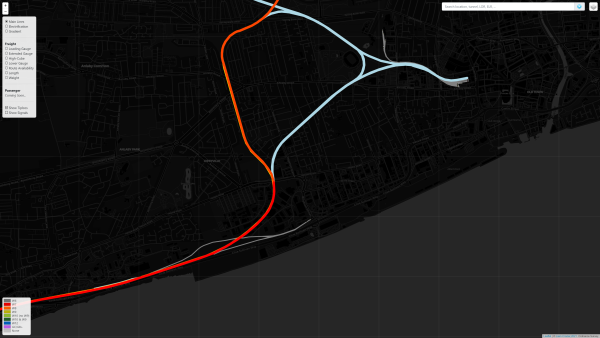
Shows track level detail for any schedules that uses this tiploc. This allows showing flows in more detail.
Track Level Detail
Loading...
Getting Data
Please wait whilst the system retrieves the data...
FAQs & Copyright Information
This data has the following limitations:
You must not download, take a copy or by other means steal the raw data without permission.
You must not distribute the data without permission.
Any data must not be relied upon for safety critical purposes.
This data may only be used for commercial purposes with permission.
How is this data kept up-to-date?
Depending on the data source, the data is kept up-to-date with periodic Freedom of Information requests and automation.
Acknowledgements
I would like to say thank you to various members at Network Rail, Network Rail FOI team, and members at RailForums UK for providing the data and expertise.
Note: The track line quality for mapping has been purposely reduced for increased performance. More noticeable when zoomed in.
Data Notice
This data may only be used for commercial purposes with permission. It should not be relied upon for safety critical purposes.
Please enter at least one value
Head Code
Train UID
Origin
Destination
No input specified.
Note
You need to be logged in to use this feature.
Privacy: Inputs are recorded anonymously for internal statistics and testing purposes only.
Routing Statistics
Success Rate These cards show the number of requests made within the last 31 days.
Note: Sudden dips in line speeds can indicate going through a station or using a crossover to change tracks.
Speed (mph)
Total (miles/km/metres)
Percentage
Speed (mph)
Total (miles/km/metres)
Percentage
Electrification
Electrification
Total (miles/km/metres)
Percentage
Breakdown
Electrification
Total (miles/km/metres)
Percentage
Gradient and Elevation Profile
Calculated Route (Adjusted)
The elevation is adjusted at every tiploc that isn't in a tunnel or on a bridge. The sections between tiplocs are calculated based on the mapped gradient data.
Calculated Route (Original)
Excluding the start elevation, the route elevation is based on the gradient data mapped on the geospatial data.
Open Elevation
The mapped elevation at the start/end of each section using a free and open-source API.
 Please wait whilst the system retrieves the data...